
Learning “How to inspect on Chromebook” is a vital skill for many users navigating the digital intricacies of this unique operating system. Especially for those transitioning from other platforms, this feature becomes a frequent point of inquiry. The Chrome OS, designed with a balance of user-friendliness and advanced functionalities, presents the “Inspect Element” tool. This feature, essential for web developers, designers, and tech enthusiasts, offers a comprehensive look into the architecture of web pages.
Gaining proficiency in inspecting on a Chromebook not only amplifies your browsing control but also sheds light on the complexities of web design and structure. Whether your objective is to troubleshoot issues, absorb new knowledge, or satisfy a simple technological curiosity, this capability is an indispensable component of your Chromebook toolkit.
Understanding How to Inspect on Chromebook: Delving into ‘Inspect Element’
On a Chromebook, the “Inspect Element” feature is more than just a handy tool; it’s an integral component of the Chrome Developer Tools, often referred to as DevTools. This toolset, curated meticulously for developers and inquisitive users alike, allows one to delve deep into the architecture of web pages, making sense of their structure and design nuances.
Utilizing the “Inspect Element” tool on a Chromebook means you can troubleshoot potential issues, play around with web designs in real-time, and do so without the fear of making irreversible changes. It’s the perfect sandbox environment for those eager to understand the digital intricacies of websites.
Step-by-step Guide to Inspect an Element
- Open Chrome Browser: Ensure you are using the Chrome browser on your Chromebook as it offers a seamless experience with the Inspect Element feature.
- Navigate to the Desired Page: Browse the website or page where you wish to inspect an element.
- Open the Context Menu: Hover your cursor over the element you want to inspect. Right-click (or two-finger tap on the touchpad) to reveal the context menu.
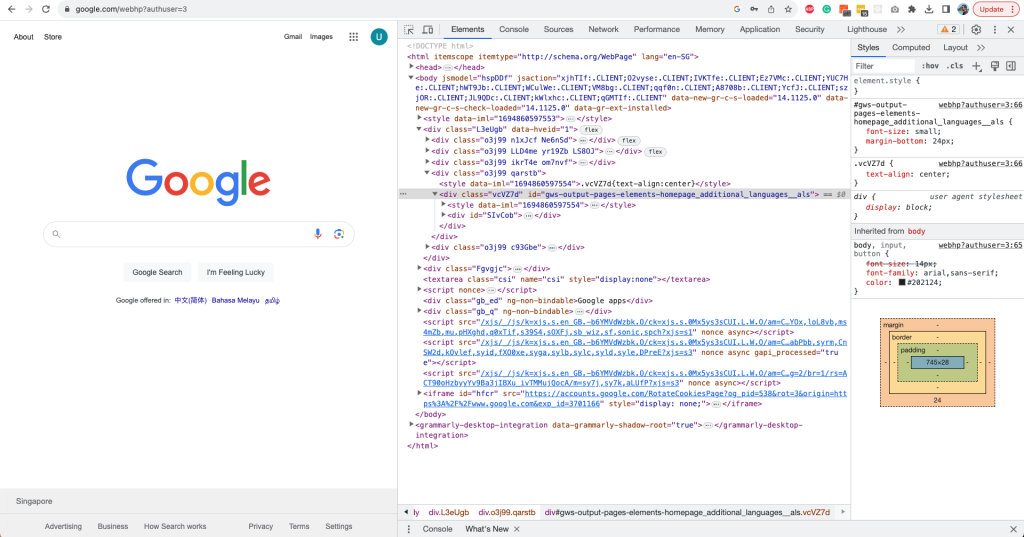
- Select “Inspect”: In the dropdown menu, find and click on the “Inspect” option. This will open the DevTools panel either on the right side or at the bottom of your Chrome browser, depending on your settings.
- Navigate Through the Source Code: In the DevTools panel, you will see the source code of the web page highlighted to the specific element you’ve selected. You can expand or collapse code snippets, modify styles, and more.
- Close DevTools: Once done, you can close the DevTools panel by clicking on the “X” icon at the top right corner of the panel.
Alternative Methods to Open DevTools
- Keyboard Shortcut: Press
Ctrl+Shift+Isimultaneously. - From Chrome Menu: Click on the three vertical dots (⋮) at the top-right corner of the browser > More tools > Developer tools.
- Right-Click Method: On any web page, simply right-click and choose “Inspect” or “Inspect Element” from the dropdown menu. This method is particularly handy for quickly accessing a specific section of the webpage you want to investigate.
- Using the URL: In the address bar, type “chrome://inspect” and press enter. This will take you to a Chrome page that displays all currently open tabs, allowing you to select which one you want to inspect.
Understanding how to inspect on Chromebook encompasses more than just the basics of opening the DevTools. The multiple pathways highlighted above ensure you have flexible and efficient ways to delve into the structural depths of web pages. Whether you’re debugging, tweaking designs, or simply learning, these methods make the process seamless and user-friendly.
Exploring the Features of DevTools
While the primary function of the “Inspect” feature is to view the source code and styles of a particular element, DevTools offers various tabs to explore:
- Elements: View and modify the structure and styling of web content.
- Console: View logs, errors, and interact with the JavaScript on the page.
- Sources: Debug your JavaScript code.
- Network: Monitor network requests and responses.
- Performance: Analyze runtime performance.
Importance of Inspecting on a Chromebook
In the age of digital transparency, having the ability to inspect elements on a web page has become more crucial than ever, particularly for those using Chromebook laptops. But why is this feature so indispensable?
1. Uncover Hidden Information: At a surface glance, web pages display tailored content for the general user. However, a wealth of information lies beneath. By inspecting elements, one can unveil this hidden data, offering deeper insights into the webpage’s structure and functionality.
2. Keyword Exploration: One of the primary advantages is the ability to search for specific keywords within the webpage’s code. This is especially beneficial for SEO analysts and digital marketers who want to understand keyword placements on a site.
3. Modify and Experiment with Web Design: Have you ever wondered how a webpage might look with a different color scheme or font? By editing the CSS and HTML files directly from the inspection tool, you can temporarily alter the design of the webpage, enabling a real-time preview of potential modifications.
4. Dive into the Console Panel: The console isn’t just a display of codes; it’s a playground for developers. You can test new features, run scripts, and interact with the webpage in ways the general viewer can’t.
5. Access the Blueprint – Source Code: The source code is essentially the blueprint of a webpage. By viewing it, one gains insights into how the webpage is constructed, the technologies implemented, and the hierarchy of elements.
6. Debugging with Precision: Errors and glitches are inevitable in the digital realm. The inspect tool facilitates efficient debugging, helping developers identify and resolve issues promptly.
7. Image Retrieval: Beyond text and code, inspecting allows users to access and download images from a webpage, even those that might not be readily downloadable through traditional means.
In essence, understanding how to inspect on a Chromebook is akin to possessing a magnifying glass for the digital world. Whether you’re a developer, a designer, or just an inquisitive user, the tool enriches your browsing experience, granting a clearer perspective of the vast and intricate web landscape.
How to Unblock the Inspect Element Option on Chromebook
Gaining access to a web page’s underlying code can be insightful, especially for those keen on web development or troubleshooting. The “Inspect Element” feature serves this purpose. However, on some Chromebook devices, especially those provided by educational institutions, this option may be restricted. If you’re pondering on how to unblock the Inspect Element option on Chromebook, here’s a comprehensive guide.
Why Might the Inspect Element Be Blocked?
Often, Chromebooks issued by schools or organizations have certain administrative restrictions to ensure that the devices are used purely for academic or official purposes. One of these potential restrictions could be disabling the Inspect Element feature.
Steps to Unblock the Inspect Element via Disabling JavaScript:
While there isn’t a direct method to unblock the inspect element on Chromebooks, an alternative route involves disabling the JavaScript option. Here’s how:
- Access Chrome Settings: Launch your Chrome browser. In the top right corner, you’ll see a three-dot menu icon. Click on it to access additional options.
- Head to Site Settings: Within the dropdown, type in or search for “javascript.” Click on “Site Settings” that appears in the results.
- Navigate to the JavaScript Option: In the list of site settings, locate and select the “JavaScript” menu.
- Disable JavaScript: To block all sites from running JavaScript, choose the “Don’t allow sites to use JavaScript” option.
- Disable JavaScript for Specific Sites (Optional): If you only want to disable JavaScript for certain websites, you can select the customized behavior option. Then click on “add site” and specify the sites where you wish to block JavaScript.
After these steps, when you right-click on a website, the “Inspect” option should now be visible and accessible.
What’s the Value of the Inspect Element?
The Inspect Element tool is more than just a peek behind the digital curtain. It’s a developer-centric feature, enabling users to view, analyze, and even modify web code temporarily. This facilitates an understanding of web structure, design, and helps in identifying areas of improvement or issues.
What If These Steps Don’t Work?
If the aforementioned method doesn’t grant access to the Inspect Element feature, it might be due to deep-rooted administrative restrictions. In such cases, it’s advisable to contact the Chromebook’s administrator for permissions or consider acquiring a personal Chromebook for unrestricted access.
In conclusion, while administrative barriers might pose challenges in accessing certain features, understanding how to unblock the Inspect Element option on Chromebook can help bridge the gap between user curiosity and the vast world of web development.
FAQs
Can I save the changes made using Inspect Element permanently?
No, changes made using the Inspect Element tool are temporary and are lost once the page is refreshed.
Is it legal to inspect elements on all websites?
Inspecting an element is generally legal as you’re viewing publicly available source code. However, modifying or using the content without permission might infringe on copyrights or terms of service.
Why can’t I see the “Inspect” option in my context menu?
Ensure you are using the Chrome browser. If the issue persists, it might be due to certain restrictions placed by administrators or the website itself.
Can I use DevTools on other browsers in a Chromebook?
While this guide focuses on Chrome, browsers like Firefox and Edge also offer developer tools with similar features.
Can I learn web development using the Inspect Element tool?
Absolutely! Many web developers started their journey by exploring and understanding web structures using this tool. It’s a great way to see how elements relate and how styles are applied.
Conclusion
Understanding how to inspect on a Chromebook is a simple yet powerful skill. Whether you’re curious about web design, troubleshooting a page, or just experimenting, the Inspect Element feature on your Chromebook is a valuable tool to delve into the intricacies of web development. Armed with this knowledge, you’re now equipped to explore the vast world of web content like never before.
s you with greater control over your browsing experience but also provides invaluable insights into web design and structure. Whether you’re troubleshooting, learning, or simply satiating your curiosity, mastering this skill is a noteworthy addition to your digital toolkit on a Chromebook.
If you’ve enjoyed understanding how to inspect elements on a Chromebook, you might be intrigued by how similar functionalities work on popular applications like Discord. Delve deeper into digital inspection with our comprehensive guide on “How to Inspect Element Discord: A Step-by-Step Guide”. Learn how to navigate and modify elements within the Discord app, enhancing your expertise in web diagnostics and customization. Don’t miss out on mastering another essential digital skill!


